Tag: wind speed

  • Capturing Min / Max Weather values in a Home Assistant Entity

    Tracking daily weather extremes in Home Assistant can be a really useful addition to your dashboard, especially if you’re keen to understand trends over time or highlight key information visually.

    Screenshot 2025-09-01 at 11.29.31

    In my case, I wanted a lightweight, efficient way to display the maximum temperature, minimum temperature, and maximum wind speed recorded during the day. Not only does this create a simple historical snapshot, but it also enables me to power Mushroom Template Cards with rich attribute data, without needing to rely on external integrations or long-term statistics.

    The Template Sensor

    Here’s the YAML I used to create a template sensor that records today’s key weather stats. This sensor uses a combination of state and time-based triggers to reset at midnight and accumulate data throughout the day.

    - trigger:
        - platform: state
          entity_id: 
            - sensor.tempest_temperature
            - sensor.tempest_wind_speed
        - platform: time
          at: "00:00:00"
      sensor:
        - name: 'Today Weather Statistics'
          unique_id: today_weather_statistics
          state: "OK"
          attributes:
            max_temp: >
              {% set t_new = states('sensor.tempest_temperature') | float(-99) %}
              {% set prev = this.attributes.max_temp | float(-99) %}
              {{ [t_new, prev] | max if trigger.platform != 'time' else t_new }}
            min_temp: >
              {% set t_new = states('sensor.tempest_temperature') | float(99) %}
              {% set prev = this.attributes.min_temp | float(99) %}
              {{ [t_new, prev] | min if trigger.platform != 'time' else t_new }}
            max_wind: >
              {% set w_new = states('sensor.tempest_wind_speed') | float(-1) %}
              {% set prev = this.attributes.max_wind | float(-1) %}
              {{ [w_new, prev] | max if trigger.platform != 'time' else w_new }}

    How it works

    • State triggers respond to changes in sensor.tempest_temperature and sensor.tempest_wind_speed. Every time they update, the template checks if the new value exceeds (or undercuts) the previous attribute value and stores the result.
    • Midnight reset is achieved via a time-based trigger at 00:00:00. At this point, the values reset to the current readings (effectively seeding the day).
    • The state is set to "OK" as a placeholder—it’s not used for charting or display, but helps avoid null states.

    Home Assistant issues with adding new attributes

    I found (randomly it seems not predictably) that some of the new attributes would not be created on their first load, once I restarted Home Assistant. It was very frustrating to debug, the logic is to set a variable from a entity state, or otherwise set a float – but something is failing. If you too are finding that the attribute isnt appearing, instead – establish the attribute more simply with a default value. Restart HA and confirm the attribute now shows up. E.g.

            max_wind: >
              {{ float(0) }}

    This creates the new max_wind attribute with a default value of 0.0. Now update your YAML per the above with the logic to capture the maximum wind speed, this time it should update without issue.

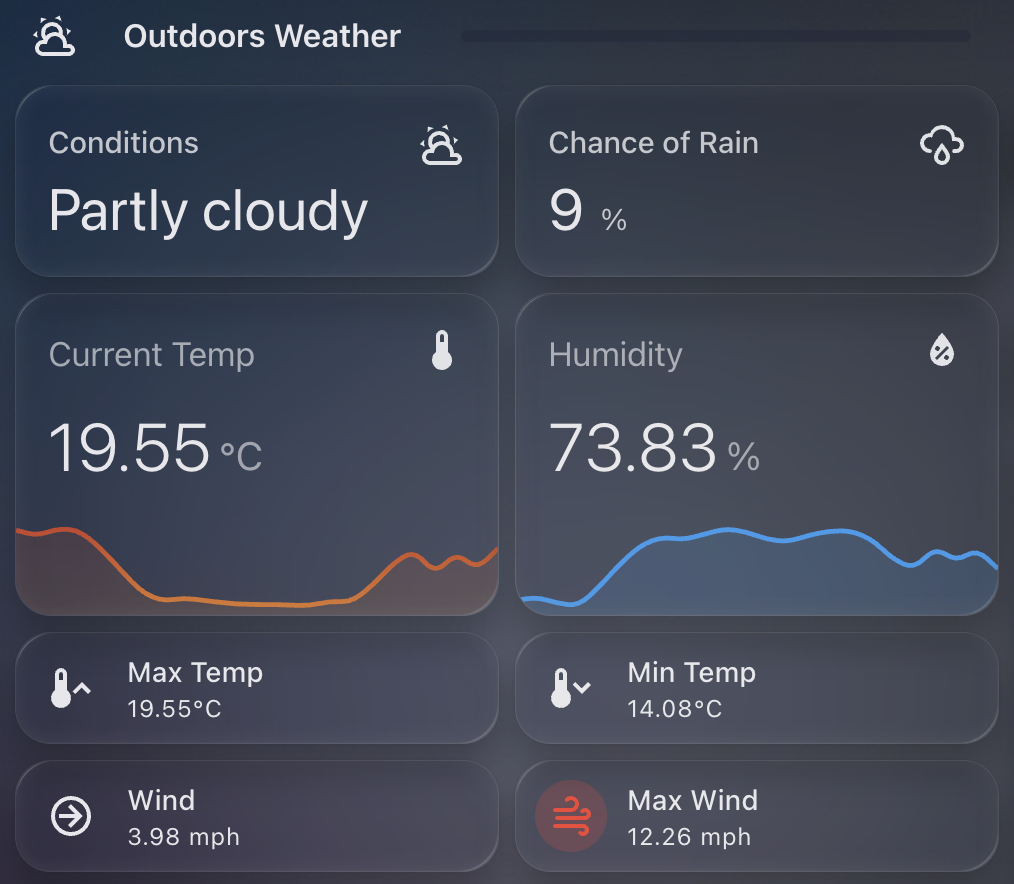
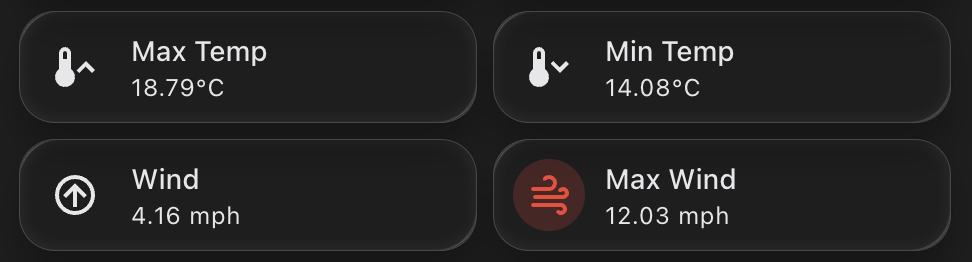
    Using This Sensor in Mushroom Cards

    Now that the max and min values are stored in the attributes, you can easily access them in mushroom-template-card components. Here’s an example that shows the max temperature for today:

    - type: custom:mushroom-template-card
      primary: "Max Temp"
      secondary: >
        {{ state_attr('sensor.today_weather_statistics', 'max_temp') | round(1) }}°C
      icon: mdi:thermometer-high

    Or for minimum temperature:

    - type: custom:mushroom-template-card
      primary: "Min Temp"
      secondary: >
        {{ state_attr('sensor.today_weather_statistics', 'min_temp') | round(1) }}°C
      icon: mdi:thermometer-low

    And similarly for wind:

    - type: custom:mushroom-template-card
      primary: "Max Wind"
      secondary: >
        {{ state_attr('sensor.today_weather_statistics', 'max_wind') | round(1) }} mph
      icon: mdi:weather-windy

    Why I Like This Approach

    • It’s simple and fast. No need to use mulitple sensors or long-term statistics.
    • It works entirely in real-time, using native templating.
    • It powers lightweight dashboard cards with just the information I want to see.
    • It’s resettable and predictable – every day starts clean at midnight.
  • A Small but Mighty Wind Card in Home Assistant

    As part of refining my Home Assistant dashboards, I wanted a lightweight, dynamic card to show current wind conditions from my Weatherflow Tempest.

    Screenshot 2025-09-01 at 12.36.38

    There are plenty of ways to visualise weather data, but most are either too large, too basic, or just not very readable. I wanted something compact, clean, and glanceable. A quick read, no fluff, and no wasted screen space.

    This is where the Mushroom Template Card really shines. It’s incredibly flexible, looks modern, and lets you pack a surprising amount of intelligence into a small card.

    What I Wanted

    The goal was simple:

    • Show the wind speed in mph.
    • Display a directional icon based on wind direction.
    • Change the icon colour if wind speed is high.
    • Keep it compact, no charts, no clutter.

    All powered by the Tempest sensors I already had in place.

    The YAML

    Here’s the full YAML I ended up with:

    type: custom:mushroom-template-card
    entity: sensor.tempest_wind_speed
    primary: Wind
    secondary: "{{ states('sensor.tempest_wind_speed') | float | round(2) }} mph"

    The secondary line uses Jinja2 to pull the wind speed and round it to two decimal places. I like that this keeps it readable without unnecessary decimals.

    Directional Icon Logic

    The icon is where it gets a bit more clever. If the wind sensor is reporting a valid direction and the wind isn’t zero, we map it to a directional arrow.

    icon: >-
      {% set raw_dir = states('sensor.tempest_wind_direction') %}
      {% set raw_speed = states('sensor.tempest_wind_speed') %}
      {% if raw_dir in ['unknown', 'unavailable', 'none', ''] or raw_speed | float == 0 %}
        mdi:compass
      {% else %}
        {% set d_from = ((raw_dir | float) % 360 + 360) % 360 %}
        {% set d_to = (d_from + 180) % 360 %}
        {% set idx = (((d_to + 22.5) % 360) // 45) | int %}
        {% set icons = [
          'mdi:arrow-up-circle-outline',
          'mdi:arrow-top-right-thin-circle-outline',
          'mdi:arrow-right-circle-outline',
          'mdi:arrow-bottom-right-thin-circle-outline',
          'mdi:arrow-down-circle-outline',
          'mdi:arrow-bottom-left-thin-circle-outline',
          'mdi:arrow-left-circle-outline',
          'mdi:arrow-top-left-thin-circle-outline'
        ] %}
        {{ icons[idx] }}
      {% endif %}

    Let me break that down:

    • If the direction or speed is unknown or zero, we show a generic compass icon.
    • Otherwise, we:
      • Calculate the direction the wind is going to (not coming from).
      • Convert it into an index between 0–7.
      • Map that to one of eight arrow icons using Material Design Icons (MDI).

    This gives a visual indication of direction without needing to read degrees.

    Icon Colour Based on Wind Speed

    Just for a bit of extra UX, I wanted the icon to go red if the wind is high (10+ mph). Otherwise, it uses the theme’s default colour.

    icon_color: >-
      {% set raw_speed = states('sensor.tempest_wind_speed') | float %}
      {% if raw_speed >= 10 %}
        red
      {% else %}
        "var(text-primary-color)"
      {% endif %}

    This makes it easy to spot when it’s particularly gusty outside without taking up extra space or alerting.

    Final Touch

    Finally, I added a tap action to bring up the more-info panel when you tap the card.

    tap_action:
      action: more-info

    That way, if I want to see the raw data or history graph, it’s just a tap away.

    Result

    What I ended up with is a sleek little wind tile that blends into my dashboard, gives me useful info at a glance, and doesn’t crowd the interface.

    It’s one of those tiny details that makes the whole dashboard feel more alive.

    shows a dashboard of weather widgets, wind, rain, temperature

    Entire YAML

    type: custom:mushroom-template-card
    entity: sensor.tempest_wind_speed
    primary: Wind
    secondary: "{{ states('sensor.tempest_wind_speed') | float | round(2) }} mph"
    icon: >-
      {% set raw_dir = states('sensor.tempest_wind_direction') %}
      {% set raw_speed = states('sensor.tempest_wind_speed') %}
      {% if raw_dir in ['unknown', 'unavailable', 'none', ''] or raw_speed | float == 0 %}
        mdi:compass
      {% else %}
        {% set d_from = ((raw_dir | float) % 360 + 360) % 360 %}
        {% set d_to = (d_from + 180) % 360 %}
        {% set idx = (((d_to + 22.5) % 360) // 45) | int %}
        {% set icons = [
          'mdi:arrow-up-circle-outline',
          'mdi:arrow-top-right-thin-circle-outline',
          'mdi:arrow-right-circle-outline',
          'mdi:arrow-bottom-right-thin-circle-outline',
          'mdi:arrow-down-circle-outline',
          'mdi:arrow-bottom-left-thin-circle-outline',
          'mdi:arrow-left-circle-outline',
          'mdi:arrow-top-left-thin-circle-outline'
        ] %}
        {{ icons[idx] }}
      {% endif %}
    icon_color: >-
      {% set raw_speed = states('sensor.tempest_wind_speed') | float %}
      {% if raw_speed >= 10 %}
        red
      {% else %}
        "var(text-primary-color)"
      {% endif %}
    tap_action:
      action: more-info