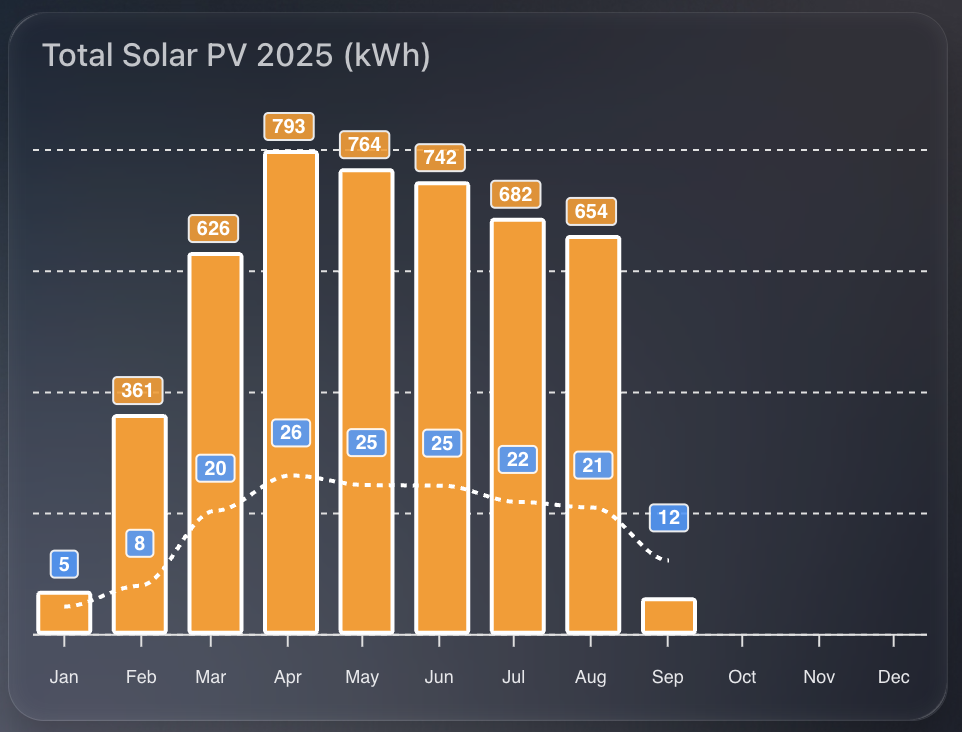
This beautiful apexcharts chart gives me a clean annual view of solar PV performance month on month.

I show two things at once:
- Total kWh per month as orange columns.
- Average daily PV for that month as a dashed line.
That pairing makes it easy to compare seasonal variation and spot how consistent generation is within each month.
1) The time window
I want a rolling 12-month view, aligned to the current year start, updating every 30 minutes.
graph_span: 12month
update_interval: 30m
span:
  start: year
  offset: "-0d"
2) Monthly totals as columns
I read SolarEdge lifetime energy, convert Wh to kWh, then sum by month. I also enable statistics so ApexCharts aligns changes to month boundaries for accurate month on month totals.
- entity: sensor.solaredge_lifetime_energy
  name: PV Last 12 Months
  color: var(--energy-solar-color)
  type: column
  float_precision: 0
  yaxis_id: first
  transform: return x / 1000;
  show:
    datalabels: true
  group_by:
    func: sum
    duration: 1month
    fill: zero
  statistics:
    type: change
    period: month
    align: end
Why:
transformconverts Wh to kWh.group_by: sumgives a single monthly bar.statistics: period: monthensures the change is aligned to the end of each month.
3) Average daily PV as a dashed line
I reuse the same entity and conversion, but average across the month, with statistics aligned by day. This produces a smooth “average day in this month” figure.
- entity: sensor.solaredge_lifetime_energy
  name: PV Last 12 Months
  type: line
  stroke_dash: 3
  float_precision: 0
  color: "#3399FF"
  yaxis_id: second
  transform: return x / 1000;
  show:
    datalabels: true
  group_by:
    func: avg
    duration: 1month
    fill: zero
  statistics:
    type: change
    period: day
    align: end
  extend_to: false
Why:
group_by: avgover a month produces the per-month daily average.statistics: period: dayuses daily changes to derive a meaningful daily rate.stroke_dash: 3makes the line read as a secondary metric.
4) Dual y-axes for tidy scales
Totals and averages sit on different ranges, so I bind columns to the left axis and the line to the right axis. Both are hidden to keep the design clean.
yaxis:
  - id: first
    decimals: 2
    show: false
    min: 0
  - id: second
    opposite: true
    decimals: 0
    min: 0
    max: 80
    show: false
5) Bar styling and stroke
I keep columns compact with a subtle corner radius, and give lines a clear white stroke outline for contrast on dark themes.
apex_config:
  plotOptions:
    bar:
      columnWidth: 28
      borderRadius: 1
  stroke:
    width: 2
    colors:
      - "#FFFFFF"
6) Data labels with a custom formatter
The line’s labels always show. Column labels only show for useful values, which keeps winter months uncluttered.
apex_config:
  dataLabels:
    offsetY: -10
    style:
      fontSize: 10
    formatter: |
      EVAL: function(value, {seriesIndex, dataPointIndex, w }) {
        const roundedValue = Number(value).toFixed(0);
        if (seriesIndex === 1) {
          return roundedValue;
        }
        return roundedValue < 100 ? '' : roundedValue;
      }
Why:
- When
seriesIndex === 1(the dashed line), always show the rounded value. - For the column series, hide values below 100 kWh to avoid visual noise.
7) Minimal legend and tooltip
This is a glanceable tile, so I remove the legend and tooltips.
apex_config:
  legend:
    show: false
  tooltip:
    enabled: false
8) Month labels
Three-letter month labels save space and remain readable.
apex_config:
  xaxis:
    labels:
      hideOverlappingLabels: false
      rotate: 90
      show: true
      style:
        fontSize: 9
      format: MMM
Full YAML
type: custom:apexcharts-card
graph_span: 12month
update_interval: 30m
span:
  start: year
  offset: "-0d"
header:
  show: true
  title: Total Solar PV 2025 (kWh)
series:
  - entity: sensor.solaredge_lifetime_energy
    name: PV Last 12 Months
    color: var(--energy-solar-color)
    type: column
    float_precision: 0
    yaxis_id: first
    transform: return x / 1000;
    show:
      datalabels: true
    group_by:
      func: sum
      duration: 1month
      fill: zero
    statistics:
      type: change
      period: month
      align: end
  - entity: sensor.solaredge_lifetime_energy
    name: PV Last 12 Months
    type: line
    stroke_dash: 3
    float_precision: 0
    color: "#3399FF"
    yaxis_id: second
    transform: return x / 1000;
    show:
      datalabels: true
    group_by:
      func: avg
      duration: 1month
      fill: zero
    statistics:
      type: change
      period: day
      align: end
    extend_to: false
yaxis:
  - id: first
    decimals: 2
    show: false
    min: 0
  - id: second
    opposite: true
    decimals: 0
    min: 0
    max: 80
    show: false
apex_config:
  chart:
    height: 300px
  legend:
    show: false
  plotOptions:
    bar:
      columnWidth: 28
      borderRadius: 1
  stroke:
    width: 2
    colors:
      - "#FFFFFF"
  tooltip:
    enabled: false
  dataLabels:
    offsetY: -10
    style:
      fontSize: 10
    formatter: |
      EVAL: function(value, {seriesIndex, dataPointIndex, w }) {
        const roundedValue = Number(value).toFixed(0);
        if (seriesIndex === 1) {
          return roundedValue;
        }
        return roundedValue < 100 ? '' : roundedValue;
      }
  xaxis:
    labels:
      hideOverlappingLabels: false
      rotate: 90
      show: true
      style:
        fontSize: 9
      format: MMM


