As part of refining my Home Assistant dashboards, I wanted a lightweight, dynamic card to show current wind conditions from my Weatherflow Tempest.
There are plenty of ways to visualise weather data, but most are either too large, too basic, or just not very readable. I wanted something compact, clean, and glanceable. A quick read, no fluff, and no wasted screen space.
This is where the Mushroom Template Card really shines. It’s incredibly flexible, looks modern, and lets you pack a surprising amount of intelligence into a small card.
What I Wanted
The goal was simple:
- Show the wind speed in mph.
- Display a directional icon based on wind direction.
- Change the icon colour if wind speed is high.
- Keep it compact, no charts, no clutter.
All powered by the Tempest sensors I already had in place.
The YAML
Here’s the full YAML I ended up with:
type: custom:mushroom-template-card
entity: sensor.tempest_wind_speed
primary: Wind
secondary: "{{ states('sensor.tempest_wind_speed') | float | round(2) }} mph"
The secondary line uses Jinja2 to pull the wind speed and round it to two decimal places. I like that this keeps it readable without unnecessary decimals.
Directional Icon Logic
The icon is where it gets a bit more clever. If the wind sensor is reporting a valid direction and the wind isn’t zero, we map it to a directional arrow.
icon: >-
  {% set raw_dir = states('sensor.tempest_wind_direction') %}
  {% set raw_speed = states('sensor.tempest_wind_speed') %}
  {% if raw_dir in ['unknown', 'unavailable', 'none', ''] or raw_speed | float == 0 %}
    mdi:compass
  {% else %}
    {% set d_from = ((raw_dir | float) % 360 + 360) % 360 %}
    {% set d_to = (d_from + 180) % 360 %}
    {% set idx = (((d_to + 22.5) % 360) // 45) | int %}
    {% set icons = [
      'mdi:arrow-up-circle-outline',
      'mdi:arrow-top-right-thin-circle-outline',
      'mdi:arrow-right-circle-outline',
      'mdi:arrow-bottom-right-thin-circle-outline',
      'mdi:arrow-down-circle-outline',
      'mdi:arrow-bottom-left-thin-circle-outline',
      'mdi:arrow-left-circle-outline',
      'mdi:arrow-top-left-thin-circle-outline'
    ] %}
    {{ icons[idx] }}
  {% endif %}
Let me break that down:
- If the direction or speed is unknown or zero, we show a generic compass icon.
- Otherwise, we:
- Calculate the direction the wind is going to (not coming from).
- Convert it into an index between 0–7.
- Map that to one of eight arrow icons using Material Design Icons (MDI).
This gives a visual indication of direction without needing to read degrees.
Icon Colour Based on Wind Speed
Just for a bit of extra UX, I wanted the icon to go red if the wind is high (10+ mph). Otherwise, it uses the theme’s default colour.
icon_color: >-
  {% set raw_speed = states('sensor.tempest_wind_speed') | float %}
  {% if raw_speed >= 10 %}
    red
  {% else %}
    "var(text-primary-color)"
  {% endif %}
This makes it easy to spot when it’s particularly gusty outside without taking up extra space or alerting.
Final Touch
Finally, I added a tap action to bring up the more-info panel when you tap the card.
tap_action:
  action: more-info
That way, if I want to see the raw data or history graph, it’s just a tap away.
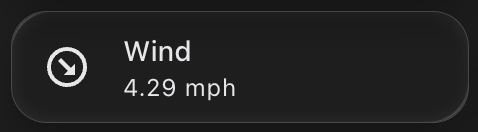
Result
What I ended up with is a sleek little wind tile that blends into my dashboard, gives me useful info at a glance, and doesn’t crowd the interface.
It’s one of those tiny details that makes the whole dashboard feel more alive.
Entire YAML
type: custom:mushroom-template-card
entity: sensor.tempest_wind_speed
primary: Wind
secondary: "{{ states('sensor.tempest_wind_speed') | float | round(2) }} mph"
icon: >-
  {% set raw_dir = states('sensor.tempest_wind_direction') %}
  {% set raw_speed = states('sensor.tempest_wind_speed') %}
  {% if raw_dir in ['unknown', 'unavailable', 'none', ''] or raw_speed | float == 0 %}
    mdi:compass
  {% else %}
    {% set d_from = ((raw_dir | float) % 360 + 360) % 360 %}
    {% set d_to = (d_from + 180) % 360 %}
    {% set idx = (((d_to + 22.5) % 360) // 45) | int %}
    {% set icons = [
      'mdi:arrow-up-circle-outline',
      'mdi:arrow-top-right-thin-circle-outline',
      'mdi:arrow-right-circle-outline',
      'mdi:arrow-bottom-right-thin-circle-outline',
      'mdi:arrow-down-circle-outline',
      'mdi:arrow-bottom-left-thin-circle-outline',
      'mdi:arrow-left-circle-outline',
      'mdi:arrow-top-left-thin-circle-outline'
    ] %}
    {{ icons[idx] }}
  {% endif %}
icon_color: >-
  {% set raw_speed = states('sensor.tempest_wind_speed') | float %}
  {% if raw_speed >= 10 %}
    red
  {% else %}
    "var(text-primary-color)"
  {% endif %}
tap_action:
  action: more-info