The fallout from this change has been significant, with customers fighting each other, and blaming each other for these changes from Octopus. Abuse of the system being the prime candidate of anger from customers.
While the 6 hour limit of charging doesn’t impact me directly, I think the customer reaction to turn on each other is quite interesting.
In my case, I have a granny (slow) charger for my car. I do about 40 miles a day, needing about 10kWh of charge per day. Because of that, I decided I would not install a fast charger at the cost of £1500, it didnt make financial sense, and still doesn’t. Using IOG I get cheap slots when they grant them, sometimes on peak, mostly off peak. The new 6 hour limit works for me still.
Some customers in this same scenario are doing far more miles than me, and charging for many more hours. This enables their house to also run at the cheap rate. This is the abuse Octopus are trying to target.
Its disheartening to me that the anger of customers is now squared at each other, even if they are non abusers of the system that Octopus themselves put in place. I mentioned I had a slow charger on a thread this week and was quickly piled on, despite not abusing the system and using it per the Octopus terms and conditions of the service.
If Octopus want to stop abuse of slow chargers, then they have the complete control to stop it – just don’t offer the full flexibility of the service to slow chargers. Limit them only. This is 100% in their control to stop.
And customers should stop being angry at each other. If Octopus didnt want abuse of the system in the first place, they could have put rules in place to stop it from the start. They didn’t, or they didn’t enforce it.
As a parent juggling the school run every morning, there’s one thing I really don’t enjoy – scraping ice off the car while trying to wrangle two teenagers and get out the door on time. So I’ve automated the process of pre-heating and defrosting my Tesla using my WeatherFlow Tempest weather station and Home Assistant.
WeatherFlow Tempest is a smart weather station that gives me highly accurate outdoor temperature data from my own garden. More accurate, in fact, than the Tesla’s own temperature sensors when the car is asleep.
I use the Tessie integration in Home Assistant to communicate with my car. It allows me to send commands like “turn on climate control” even when the Tesla is sleeping, without the delay or failure that sometimes occurs with the native Tesla integration.
Why Use Tempest Instead of Tesla’s Own Temperature Reading?
Tesla goes into a deep sleep mode overnight to conserve energy. That’s great for battery life, but not so great if you want reliable temperature data in the early morning. The external temperature reported by the car can be outdated or missing altogether until the car is awake and responsive.
Instead, I rely on my WeatherFlow Tempest’s temperature sensor, which continues to report accurate live data overnight.
The Automation Setup
Every weekday morning at exactly 8.00am, my Home Assistant instance checks the current outside temperature reported by the Tempest. If it’s below 3°C, the automation triggers Tessie to enable climate control in the car for 15 minutes – enough to warm the cabin and defrost the windows. I also make sure I only set this on school days.
I also receive a notification letting me know that the defrost has been enabled.
Here’s the automation in full:
alias: Warm Car Automation
description: At 08.00 every school day check outside temp and defrost if below 3C
mode: single
triggers:
  - at: "08:00:00"
    platform: time
conditions:
  - condition: time
    weekday:
      - mon
      - tue
      - wed
      - thu
      - fri
  - condition: numeric_state
    entity_id: sensor.tempest_temperature
    below: 3
actions:
  - service: climate.turn_on
    target:
      entity_id: climate.none_climate
  - service: notify.notify
    data:
      message: "Car Defrost Enabled for 15 mins"
  - service: notify.persistent_notification
    data:
      title: "Car Defrost Enabled"
      message: "Car Defrost Enabled for 15 mins"
You can take this further by:
Tracking how often the automation is triggered using a counter or helper.
Adding a secondary check for battery level to avoid defrosting if your range is low.
Turning the climate off again after a set duration (or allowing Tesla’s own timeout to do it for you).
This small quality-of-life improvement saves me time and hassle every winter morning, and it’s yet another example of how Home Assistant can bring together multiple smart devices into a seamless routine.
As part of my growing Home Assistant dashboard, I’ve built a custom section to track the mileage of my electric vehicle (EV), a Tesla Model Y. It helps me visualise how I’m progressing against my lease’s mileage allowance – not just the total driven, but also how I’m pacing day to day.
This dashboard has become one of the most valuable tools in my setup, especially with a leased EV where tracking your usage is critical to avoiding end-of-term penalties.
Data Source: Tessie Integration
I’m using the excellent Tessie integration to pull live data from my Tesla. It provides an entity for the odometer (sensor.none_odometer in my case), which powers all the mileage tracking. none here is the car’s name – I hadn’t named it when I installed the integration, and now its stuck there in the entity names.
Lease Parameters
Start date: 10 February 2024
End date: 9 February 2027
Total allowed: 45,000 miles (15,000 miles per year)
What I Show on the Dashboard
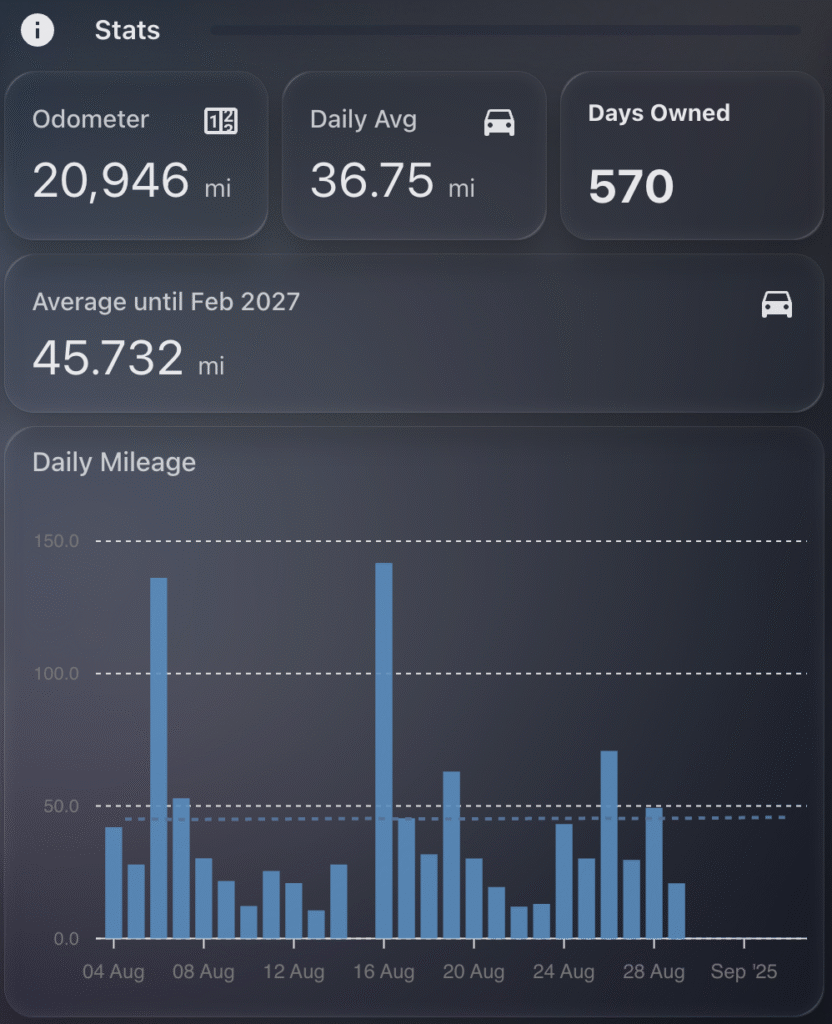
My Tesla mileage dashboard includes:
Odometer: current total mileage (live from Tessie)
Daily Avg: my average daily mileage since delivery
Days Owned: how many days since I took delivery
Target Daily Avg: how many miles I can drive per day from today to stay within my lease cap
ApexCharts Graph: daily mileage (bars) vs. target daily average (dotted line)
This gives me a clear visual indication of whether I’m tracking well or over-driving. The Target Daily Avg is based on how many miles I have used so far, and calculating the number of days remaining in the lease, so dividing mileage remaining / days left.
ApexCharts Graph
I use the apexcharts-card custom card to plot two data series:
Daily mileage from a helper or automation that tracks daily odometer deltas
Target average from a template sensor (see below)
The bar chart gives a good at-a-glance view, with the dotted line acting as a benchmark to compare against.
Template Sensors
These sensors do the logic for tracking averages.
1. Daily Average Since Delivery
- sensor:
    - name: "Average Tesla Mileage"
      unique_id: average_tesla_mileage
      state_class: "total"
      device_class: "distance"
      unit_of_measurement: "mi"
      state: >
        {% set specific_date = "2024-02-10" %}
        {% set current_date = now().date() %}
        {% set specific_date_obj = as_timestamp(specific_date) %}
        {% set current_date_obj = as_timestamp(current_date) %}
        {% set days_since_specific_date = ((current_date_obj - specific_date_obj) / 86400) | round(0, 'ceil') %}
        {% set mileage = states('sensor.none_odometer') | int %}
        {{ (mileage / days_since_specific_date) }}
      icon: mdi:car
2. Target Daily Allowance Until Lease Ends
- sensor:
    - name: "Average Tesla Mileage Remaining"
      unique_id: average_tesla_mileage_remaining
      state_class: "total"
      device_class: "distance"
      unit_of_measurement: "mi"
      state: >
        {% set specific_date = "2027-02-09" %}
        {% set current_date = now().date() %}
        {% set specific_date_obj = as_timestamp(specific_date) %}
        {% set current_date_obj = as_timestamp(current_date) %}
        {% set days_until_specific_date = ((specific_date_obj - current_date_obj) / 86400) | round(0, 'ceil') %}
        {% set mileage = states('sensor.none_odometer') | int %}
        {% set mileage_remaining = 45000 - mileage %}
        {{ (mileage_remaining / days_until_specific_date) }}
      icon: mdi:car
Markdown Card: Days Owned
This card is created using a simple markdown card that calculates the number of days since delivery:
- type: markdown
  content: >-
    #### Days Owned

    {% set specific_date = "2024-02-10" %}
    {% set current_date = now().date() %}
    {% set specific_date_obj = as_timestamp(specific_date) %}
    {% set current_date_obj = as_timestamp(current_date) %}
    {% set days_since_specific_date = ((current_date_obj - specific_date_obj) / 86400) | round(0, 'ceil') %}

    # {{ days_since_specific_date }}
It displays a nice clean numeric summary alongside the stats and graph.
Example Stats (as of today)
Odometer: 20,946 miles
Daily Avg: 36.75 miles
Target Avg: 45.73 miles
Days Owned: 570 days
So I’m under the target, which gives me some breathing room for long trips.