As part of my growing Home Assistant dashboard, I’ve built a custom section to track the mileage of my electric vehicle (EV), a Tesla Model Y. It helps me visualise how I’m progressing against my lease’s mileage allowance – not just the total driven, but also how I’m pacing day to day.
This dashboard has become one of the most valuable tools in my setup, especially with a leased EV where tracking your usage is critical to avoiding end-of-term penalties.
Data Source: Tessie Integration
I’m using the excellent Tessie integration to pull live data from my Tesla. It provides an entity for the odometer (sensor.none_odometer in my case), which powers all the mileage tracking. none here is the car’s name – I hadn’t named it when I installed the integration, and now its stuck there in the entity names.
Lease Parameters
- Start date: 10 February 2024
- End date: 9 February 2027
- Total allowed: 45,000 miles (15,000 miles per year)
What I Show on the Dashboard
My Tesla mileage dashboard includes:
- Odometer: current total mileage (live from Tessie)
- Daily Avg: my average daily mileage since delivery
- Days Owned: how many days since I took delivery
- Target Daily Avg: how many miles I can drive per day from today to stay within my lease cap
- ApexCharts Graph: daily mileage (bars) vs. target daily average (dotted line)
This gives me a clear visual indication of whether I’m tracking well or over-driving. The Target Daily Avg is based on how many miles I have used so far, and calculating the number of days remaining in the lease, so dividing mileage remaining / days left.
ApexCharts Graph
I use the apexcharts-card custom card to plot two data series:
- Daily mileage from a helper or automation that tracks daily odometer deltas
- Target average from a template sensor (see below)
The bar chart gives a good at-a-glance view, with the dotted line acting as a benchmark to compare against.
Template Sensors
These sensors do the logic for tracking averages.
1. Daily Average Since Delivery
- sensor:
    - name: "Average Tesla Mileage"
      unique_id: average_tesla_mileage
      state_class: "total"
      device_class: "distance"
      unit_of_measurement: "mi"
      state: >
        {% set specific_date = "2024-02-10" %}
        {% set current_date = now().date() %}
        {% set specific_date_obj = as_timestamp(specific_date) %}
        {% set current_date_obj = as_timestamp(current_date) %}
        {% set days_since_specific_date = ((current_date_obj - specific_date_obj) / 86400) | round(0, 'ceil') %}
        {% set mileage = states('sensor.none_odometer') | int %}
        {{ (mileage / days_since_specific_date) }}
      icon: mdi:car
2. Target Daily Allowance Until Lease Ends
- sensor:
    - name: "Average Tesla Mileage Remaining"
      unique_id: average_tesla_mileage_remaining
      state_class: "total"
      device_class: "distance"
      unit_of_measurement: "mi"
      state: >
        {% set specific_date = "2027-02-09" %}
        {% set current_date = now().date() %}
        {% set specific_date_obj = as_timestamp(specific_date) %}
        {% set current_date_obj = as_timestamp(current_date) %}
        {% set days_until_specific_date = ((specific_date_obj - current_date_obj) / 86400) | round(0, 'ceil') %}
        {% set mileage = states('sensor.none_odometer') | int %}
        {% set mileage_remaining = 45000 - mileage %}
        {{ (mileage_remaining / days_until_specific_date) }}
      icon: mdi:car
Markdown Card: Days Owned
This card is created using a simple markdown card that calculates the number of days since delivery:
- type: markdown
  content: >-
    #### Days Owned

    {% set specific_date = "2024-02-10" %}
    {% set current_date = now().date() %}
    {% set specific_date_obj = as_timestamp(specific_date) %}
    {% set current_date_obj = as_timestamp(current_date) %}
    {% set days_since_specific_date = ((current_date_obj - specific_date_obj) / 86400) | round(0, 'ceil') %}

    # {{ days_since_specific_date }}
It displays a nice clean numeric summary alongside the stats and graph.
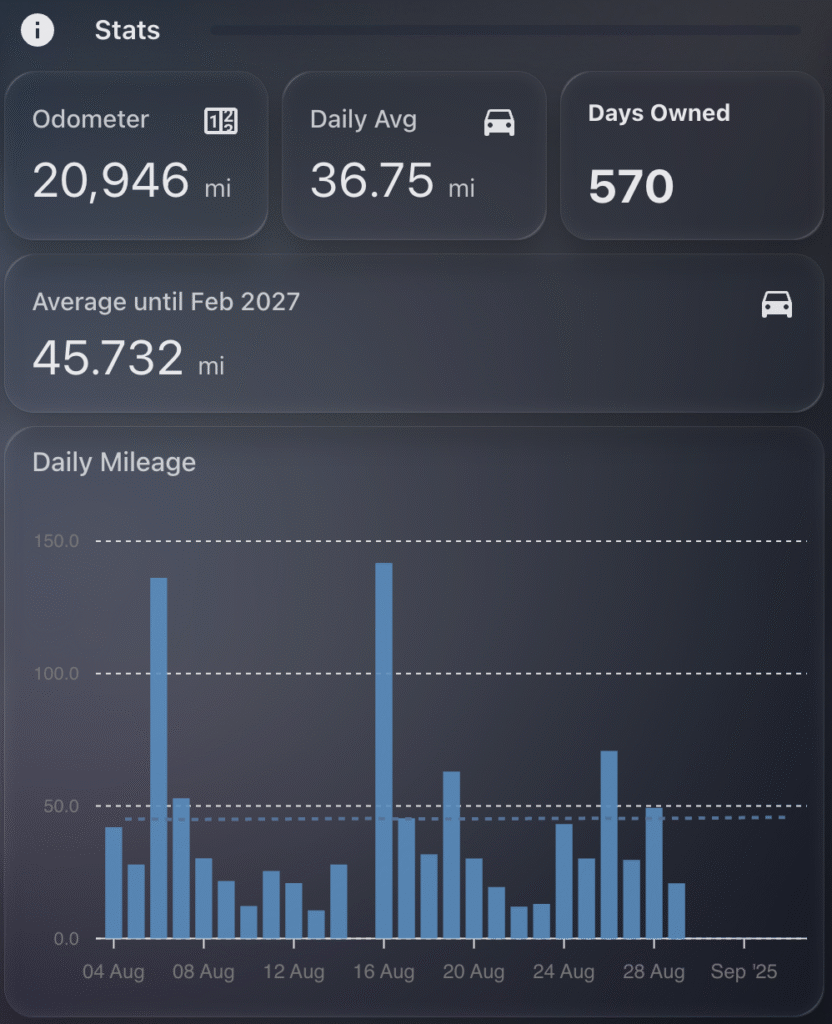
Example Stats (as of today)
- Odometer: 20,946 miles
- Daily Avg: 36.75 miles
- Target Avg: 45.73 miles
- Days Owned: 570 days
So I’m under the target, which gives me some breathing room for long trips.